Lab 2 · What a passive maker earns on Polymarket
PredictionLab, September 2026. Data: our own order-book snapshots and taker fills from May 2026, plus live CLOB books pulled on 2026-09-19 for calibration. Every number below comes from results.json (produced by extract.py + analyze.py) and the two calibration files under data/labs/maker/.
Short answer. In May 2026 the liquidity-rewards program was the whole game: on the 819 reward markets we watched, Polymarket paid out about 0.9% per day of all the capital resting inside the reward corridor (median market 1.0%), while the spread a maker captured at the touch was worth roughly 0.7¢ per share and the mid, on average, moved in the maker's favour afterwards. A two-sided quote of 1,000 shares per side at the touch modelled to 2.4% of capital per day (median market-day) under median competition, almost all of it rewards. Three things stand between that number and a bank account: you need 1,000 shares a side to be eligible on most markets (a $100 account is locked out of 96% of them), the competition estimate is uncertain by a factor of two, and the program has since compressed: on live markets today the same pool-to-liquidity ratio is 0.25% per day, a quarter of May.
Why this lab
Lab 1 ended with "the edge in longshots is a maker's edge, worth about a cent". Our own paper-maker experiments in May were killed by account size, not by the market: quoting on a $100 paper account meant one adverse fill wiped weeks of rewards, and the eligibility thresholds were never met. Nobody had actually measured, on data, what a maker in the middle of the price range would have earned. This lab does that, with the two parts of maker income separated: what the rewards program pays for resting orders, and what the fills themselves are worth once the mid moves.
Data
Order-book snapshots. 479,334 snapshots of 902 Polymarket markets between 2026-05-07 and 2026-05-29, taken by our scanner every 33 seconds (median gap) on the markets it was watching: best bid and ask, size at the touch, total resting size, and the market's reward parameters as reported by Gamma at that moment (daily pool, minimum eligible order size, maximum eligible spread, Gamma's liquidity figure). The scanner only watched markets priced between 30¢ and 80¢; nothing here is about tails. 819 of the 902 markets had an active reward pool.
Taker fills. 1,943,590 fills from Polymarket's data API over the same weeks; 1,165,152 of them on the 902 markets above. A fill enters the markout study only if a snapshot no older than 90 s exists and the fill price sits on the touch of that snapshot (within one tick, on the side the taker traded): 347,529 fills on 697 markets survive, $52.7M notional.
Live calibration. The snapshots record depth at the touch but not the ladder, and the reward corridor (1.5–4.5¢ from mid) usually holds several levels. On 2026-09-19 we pulled 37 live CLOB books in the same price range and measured how corridor depth relates to two things the snapshots do carry: it is 0.27 / 0.65 / 0.90 × (Gamma liquidity / mid) at the 25th / 50th / 75th percentile, and orders in the corridor carry on average 0.55 of the reward weight of an order at the touch. Depth at the touch is 13% of liquidity-shares on live books; that is the floor we use for the fill queue.
Fees and rewards, 2026 rules. Score per order = ((v − s)/v)² × size, v the market's max spread, s the order's distance from mid, sampled every minute; two-sided rule Q = max(min(Q₁,Q₂), max(Q₁,Q₂)/3) inside 10–90¢; daily pool split by score share; minimum payout $1. Makers pay no fee and receive a rebate of 15% (sports), 20% (crypto) or 25% (other) of the taker fee rate × p × (1−p) on each fill against them.
The model
We pretend to rest S shares on each side at the current best bid and best ask, for S in {100, 200, 500, 1,000, 5,000}, on every snapshot, and ask three things.
- Rewards. Our score share = Q_us / (Q_us + Q_book), Q_book = ρ × w × α × liquidity-shares, with α ∈ {0.27, 0.65, 0.90} (thin / median / deep competition) and ρ = 0.55. Eligible only if S ≥ the market's minimum size, our half-spread ≤ v, the pool > 0, and the day's payout ≥ $1. Capital ≈ S dollars for a two-sided quote near 50¢.
- Adverse selection. For every qualifying taker fill, the maker on the other side captured |price − mid| and then experienced the mid's move at 5, 15 and 60 minutes (markout, positive = loss).
- Net per market-day. Rewards + fills × (capture − markout₆₀ + rebate). Fills per taker trade = trade size × S / (queue + S) under pro-rata, capped at S; or, last in queue, only the part of the trade that exhausts the level.
Everything is per eligible market-day, so "% of capital per day" means: had you run exactly this on that market on that day.
Results
1. The pool was worth about 1% a day of the capital in the corridor
Summing daily pools over the 819 reward markets gives $52,841 per day. Corridor liquidity, at α = 0.65, sums to $6.1M. That is 0.86% per day paid to resting capital in aggregate, and the median market paid 1.02% (interquartile 0.16–3.98%). Half of all market-days offered more than 1% per day, seven in ten more than 0.3%.
Live check, same method, 12 reward markets on 2026-09-19: median pool $304/day against median corridor liquidity $155k, aggregate 0.25% per day (interquartile 0.13–0.42%). Pools are similar to May, corridor liquidity is roughly three times deeper. The program has been competed down by about a factor of four since our window.
2. Rewards for a quote at the touch, by size
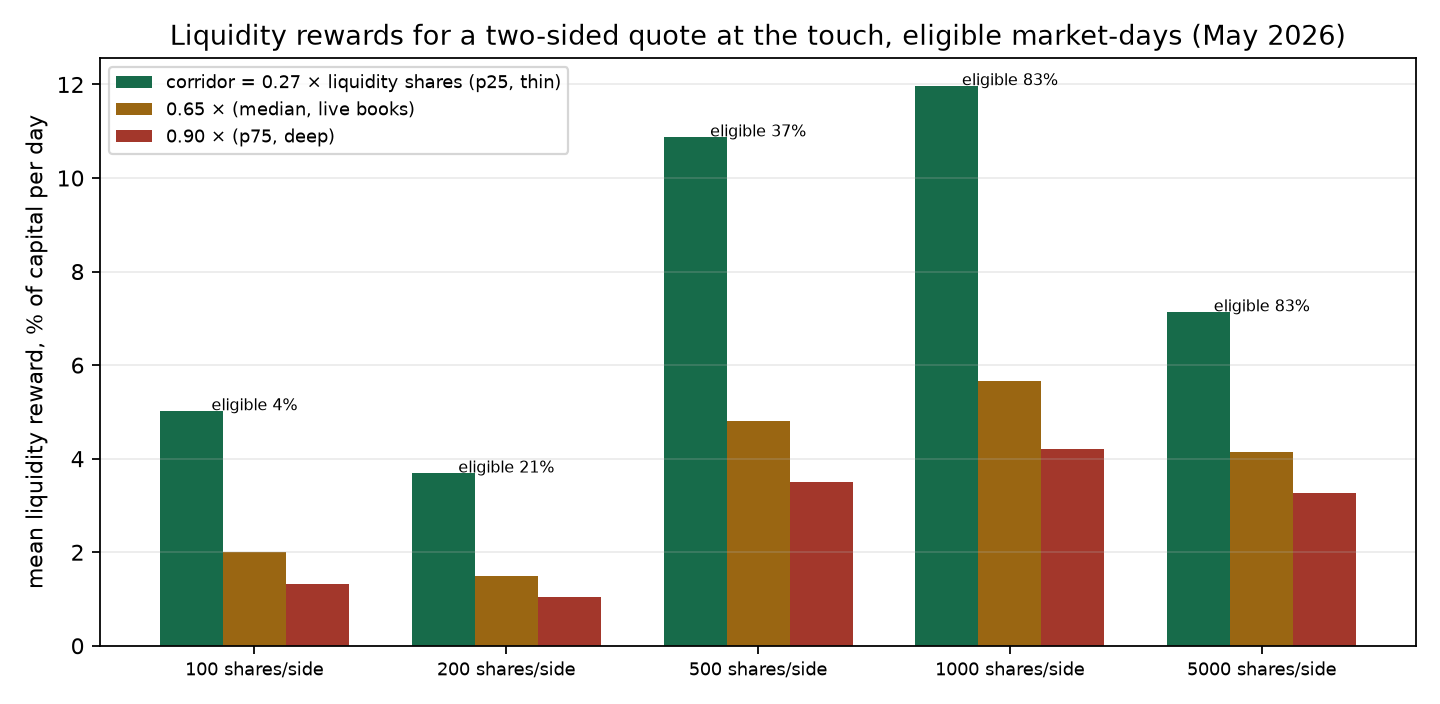
| Shares per side | Eligible market-days | Share of market-days eligible | Median reward $/day (median competition) | Median yield %/day | Mean yield %/day thin / median / deep |
|---|---|---|---|---|---|
| 100 | 58 | 4% | 0.0 | 0.00 | 5.0 / 2.0 / 1.3 |
| 200 | 278 | 21% | 1.6 | 0.78 | 3.7 / 1.5 / 1.0 |
| 500 | 490 | 37% | 7.2 | 1.45 | 10.9 / 4.8 / 3.5 |
| 1,000 | 1,090 | 83% | 22.8 | 2.28 | 12.0 / 5.7 / 4.2 |
| 5,000 | 1,090 | 83% | 91.7 | 1.83 | 7.1 / 4.1 / 3.3 |
Two mechanics dominate. Eligibility: the minimum order size is 200 shares on 53% of snapshots and 1,000 on 20%, so a 100-share quote qualifies on 4% of market-days and, where it qualifies, usually earns less than the $1 minimum payout; that is the whole story of the $100 paper account. Concentration: at 1,000 shares a side the median yield is 0.1–0.2% per day on the $30–45 pools and 10–14% per day on the $2,068+ pools, which were a campaign running on 221 of the 902 markets. Yield by price bucket is flat-ish (1.1% at 30–35¢ up to 3.9% at 45–55¢), so it is the pool, not the price, that matters.
3. Fills at the touch were not toxic on average
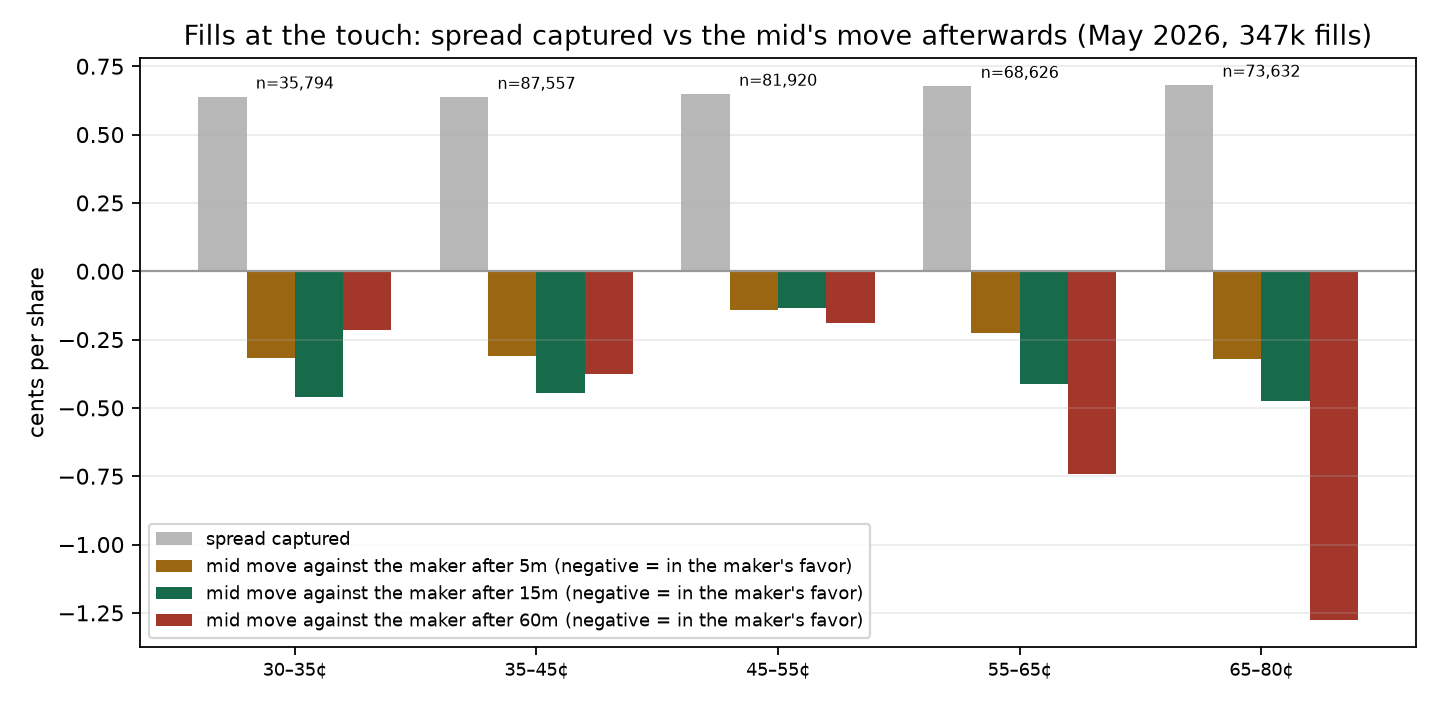
| fills | spread captured | mid move after 5 m | 15 m | 60 m | net at 60 m | net at 60 m, size-weighted | |
|---|---|---|---|---|---|---|---|
| all fills at the touch | 347,529 | 0.66¢ | −0.25¢ | −0.36¢ | −0.51¢ | +1.12¢ | +0.68¢ |
| taker sold YES (maker bought at the bid) | 170,407 | 0.66¢ | −0.48¢ | −1.81¢ | +2.43¢ | +1.75¢ | |
| taker bought YES (maker sold at the ask) | 177,122 | 0.66¢ | −0.03¢ | +0.75¢ | −0.15¢ | −0.16¢ | |
| fills that exhausted the touch (last-in-queue fills) | 676 | 0.93¢ | −0.07¢ | −0.60¢ | +1.53¢ | +2.64¢ |
Negative mid moves are in the maker's favour. On average the mid drifted back after a taker trade, so a maker at the touch kept the half-spread and gained on the reversal: +1.1¢ per share at 60 minutes, +0.7¢ size-weighted, with a 95% bootstrap interval by market of −0.03¢ to +1.41¢. The asymmetry is the finding worth keeping: sellers into the bid were uninformed (the mid rose 1.8¢ after them), buyers at the ask were informed enough to cost the maker 0.75¢ and turn the sell side of the quote slightly negative. Size-weighted, sports and financial markets flip to negative (−0.26¢ and −4.98¢), which is where the informed flow lives.
4. Net: mostly rewards
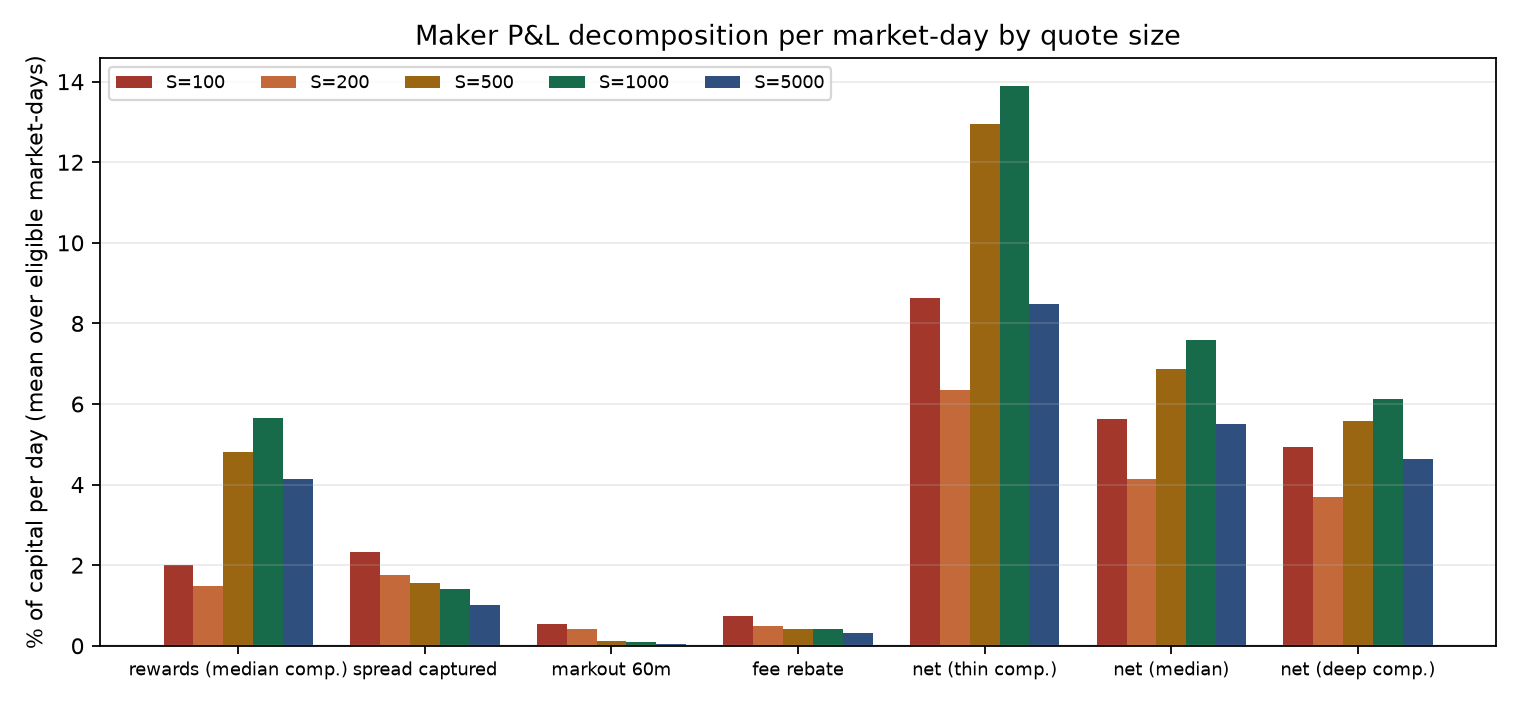
| Shares per side | Rewards, median competition | Spread captured | Mid move (favourable) | Fee rebate | Net, median competition, pro-rata fills | Net, last in queue | Net, deep competition, last in queue | Market-days with positive net |
|---|---|---|---|---|---|---|---|---|
| 100 | 2.0% | 2.3% | +0.5% | 0.7% | 5.6% | 2.7% | 2.0% | 67% |
| 200 | 1.5% | 1.7% | +0.4% | 0.5% | 4.1% | 2.0% | 1.5% | 71% |
| 500 | 4.8% | 1.6% | +0.1% | 0.4% | 6.9% | 5.3% | 4.0% | 90% |
| 1,000 | 5.7% | 1.4% | +0.1% | 0.4% | 7.6% | 6.0% | 4.5% | 88% |
| 5,000 | 4.1% | 1.0% | +0.0% | 0.3% | 5.5% | 4.4% | 3.6% | 92% |
All figures are % of capital per day, means over eligible market-days; medians are lower (2.4% net at 1,000 shares under median competition, 0.9% at 200). Turnover under pro-rata fills is 1.4–3.3× the quote per day; last in queue it is 0.1–0.2×, which is why fill income falls to a few tenths of a percent while rewards do not move. By price bucket the net for 1,000 shares runs from 5.9% (35–45¢) to 9.5% (55–65¢); by category from 1.5% (crypto, 28 market-days) to 10.4% (sports, 202).
What we would do with this
The program, not the spread, is the product. Spread capture plus rebate is worth about 1¢ per share filled, fills at the touch were benign on average, and none of it adds up to more than a percent or two a day even at full pro-rata. The rewards did. That is also the fragile part: a pool is a fixed daily budget shared by whoever rests capital inside the corridor, so every new maker dilutes every other, and the live check shows exactly that happening between May and September.
Size first, strategy second. Below 200 shares a side you are not in the program; below 1,000 you are in a fifth of it. The order of operations for a small account is therefore not "find the best market" but "pick the few markets whose minimum size you can meet and whose pool-to-corridor ratio is above the median". results.json has the per-pool yields to rank by.
Quote the bid harder than the ask. In this window sells into the bid reverted and buys at the ask did not. A quote skewed towards the bid keeps the reward score (both sides still count) while taking less of the informed side. This is the single testable idea to carry into a paper run.
What we did not measure. Inventory that is not unwound within an hour, and resolution risk: a maker who gets filled and holds to resolution is back in Lab 1's territory. Queue priority beyond two extreme scenarios. Any market outside 30–80¢. Anything after May 29. The shadow run below measures the first two on a week of live books.
Shadow run: the hypothesis on live books (19–26 September 2026)
shadow_maker.py ran the "bid-heavier quote on above-median pools" idea against live Polymarket books for a week without placing an order. Every 60 s it pulled the full CLOB book of about 40 reward markets (pool at or above the median of the candidates, mid 20–80¢, rewardsMinSize ≤ 1,000), scored a virtual 1,000-share bid at the best bid and a 500-share ask at the best ask with the exact 2026 reward formula against every resting order in the corridor, and logged every taker trade at our price as a virtual fill with the pro-rata share S/(depth+S). shadow_report.py turns the log into yields and markouts; shadow_inventory.py values every fill at the market's actual payout once it resolves. The snapshot shadow_2026-09-26.db.gz (SQLite: 388k quotes, 23k fills) is attached to the data-latest release.
| Week 1: 6.8 days, 297 markets, ~40 at a time, 99.5% of minutes sampled | |
|---|---|
| Capital in the quotes | $27.3k on average (1,000 × bid + 500 × ask per market) |
| Rewards by the formula | $1,472 a day, 5.4% of capital; median pool share 9.6%, mean 21% |
| Why the share is that large | our 1,000 exceeded the whole touch depth in 53% of minutes (median touch 809 shares); a live book would react and the share would fall |
| Virtual fills | 23,426; 194k shares a day pro-rata (3.3× the capital), about half that if last in queue |
| Spread capture | 1.84¢ a share, size-weighted, at our own quote (2.23¢ if measured at the taker's print: 18% of fills swept through our level) |
| Markout 5 / 15 / 60 min | +1.01¢ [0.88; 1.15] / +0.98¢ [0.83; 1.15] / +0.68¢ [0.54; 0.82] a share |
| Drift after the fill | −0.14 / −0.07 / −0.27¢: mild adverse selection, well inside the captured spread |
| By side, 15 min | bid fills +1.10¢, ask fills +0.79¢ |
| Fill P&L | $1,423 a day at the 15-min markout, 5.2%; "on paper" total 10.6% a day |
| Net inventory | 60k shares a day never unwound (31% of turnover) |
The May result held: fills at the touch were benign then (+0.7¢ at 5 min) and are benign now (+1.0¢). The reward yield is twice the May model's 2.4% at 1,000 shares because the live touch is thinner than the May snapshots, which is the same fact as the first caveat below.
What the markout could not see
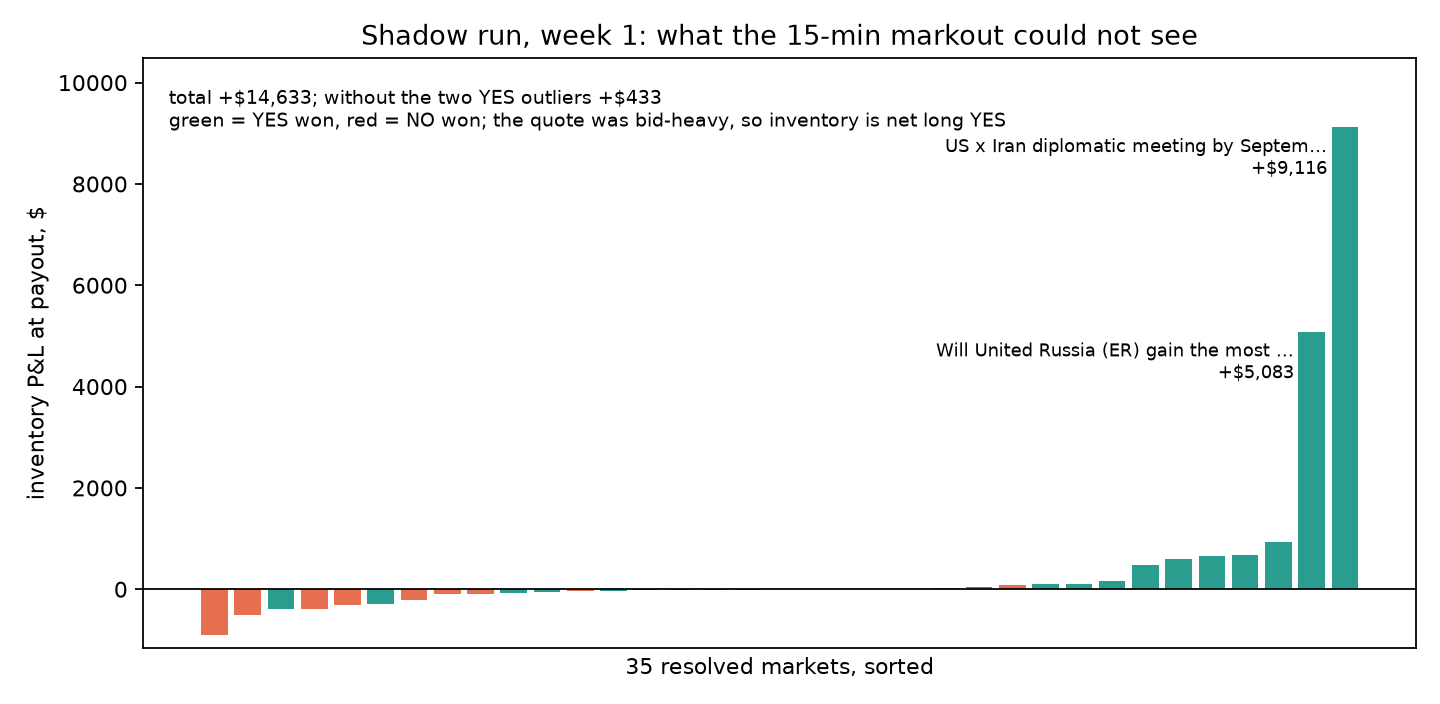
Fills are not round trips. With the bid twice the ask, the maker bought 803k shares and sold 518k over the week: a structural long in YES. By 27 September, 35 of the 242 markets with fills had resolved (3,380 fills, 188k shares):
- Valued at the payout, those fills made +$16.9k against +$4.3k at the 15-minute markout. The difference is inventory: +$14.6k.
- $14.2k of that came from two markets where YES won (a US–Iran meeting by 30 September: 16k shares bought at 44¢; United Russia winning the most seats: 24k at 79¢). Without them the inventory on the other 33 markets is +$433, the median market is +$10, and 15 of 35 are negative.
- Split by direction: long YES and YES won, 14 markets, +$18.0k; long YES and NO won, 11 markets, −$2.6k. The inventory result is a bet on YES, not maker edge.
- On the 207 still-open markets the inventory is −$3.3k at the last mid, concentrated in a few trending-down questions where the bid kept getting hit (10–25k shares each, −$1.5k to −$2.8k), every one of them with a positive 15-minute markout.
So the two measured halves of the "on paper" number are real (spread and rewards), and the third, previously unmeasured part decides the sign: a fixed quote size with no inventory control turns the maker into a directional holder. That is the first thing a live version has to add: shrink the bid when long, stop quoting a market once inventory passes a limit.
Caveats specific to the shadow: competition is frozen (nobody reacts to our size); fills are modelled pro-rata from taker prints and real queue position is unknown; 35 resolved markets in one week with two outliers is not a distribution; open markets are marked at a mid, not a payout. shadow_inventory.py is meant to be re-run in a few weeks, when more of the 207 have resolved.
Caveats
- The competition estimate transfers a September 2026 book shape (37 markets) onto May 2026 snapshots through Gamma's
liquidityfigure. The three α scenarios span the interquartile range of that sample; the truth could sit outside it, and the aggregate cross-check in section 1 is the number to trust most. - 902 markets chosen by our own scanner, not a random sample of Polymarket; 23 days; one price range.
- Reward eligibility is checked against the snapshot's spread. Markets whose spread exceeded the max spread contribute nothing, which is correct for rewards but means thin markets are under-represented.
- Fill economics assume the maker re-quotes instantly and is filled pro-rata or last; real queue position lies in between and changes with cancellations we cannot see.
- The $1 minimum payout is applied per market-day. Polymarket pays per wallet per day across markets, so small quotes spread across several markets fare slightly better than modelled.
- Rebate rates and taker fees are the July 2026 schedule; in May the sports coefficient was 0.03, not 0.05, so May rebates are slightly overstated.
Reproduce
python3 -m venv .venv && source .venv/bin/activate
pip install -r requirements.txt -r requirements-labs.txt orjson
python3 labs/2026-09-25-maker-rewards/extract.py --db data/paper_bot_prod_2026-05-29.db   # ~35 min, private database
python3 labs/2026-09-25-maker-rewards/analyze.py                                            # ~3 min
The May snapshots come from a private database and are not published; the extracted parquet files (data/labs/maker/snapshots.parquet, 11 MB; fills.parquet, 38 MB) will be attached to the data-latest release so the analysis is reproducible without the database.
Shadow run (live books, no orders):
python3 labs/2026-09-25-maker-rewards/shadow_maker.py --db data/labs/maker/shadow.db        # runs until stopped; one cycle a minute
python3 labs/2026-09-25-maker-rewards/shadow_report.py --db data/labs/maker/shadow.db       # yields, fills, markouts -> results_shadow.json
python3 labs/2026-09-25-maker-rewards/shadow_inventory.py --db data/labs/maker/shadow.db    # fills at payout via the CLOB -> results_shadow_inventory.json